 Chi-square test for independence is one of the most popular and versatile non-parametric tests. It is used to explore the association between two categorical variables. Each of these variables can have two or more categories. 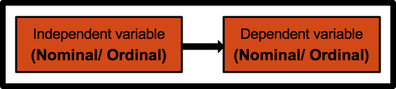 This test also compares the observed frequencies with the expected frequencies. For example, we want to explore the association between Gender ( Male / Female) and Smoking Behaviour ( Smoker/Non-Smoker). Independent and dependent variables are Gender and Smoking Behaviour respectively. Both variables are categorical variables with two categories. IV: Gender ( Male/ Female) DV: Smoking Behaviour ( Smoker / Non Smoker) Example of research question: There are a variety of ways questions can be phrased:
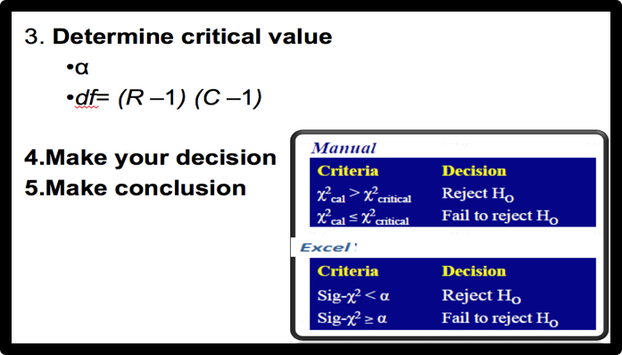
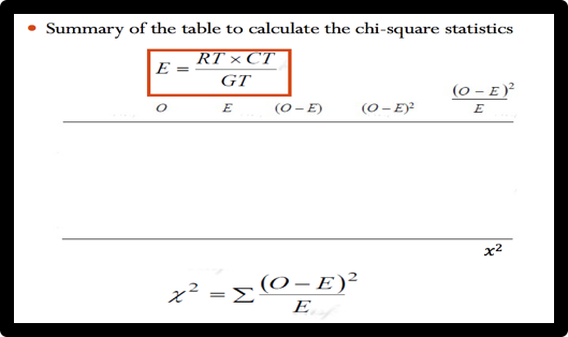
Several assumptions should be checked before conducting this analysis. Additional assumption that should be checked is the " Minimum Expected Cell Frequency". Based on this assumption, the lowest expected frequency in any cell should be 5 or more. Some authors suggest less stringent criteria: at least 80 per cent of cells should have expected frequencies of 5 or more. If we have a 1 by 2 or a 2 by 2 table, it is recommended that the expected frequency be at least 10. If we have a 2 by 2 table that violates this assumption, we should consider using Fisher's Exact Probability Test instead Steps to Solve a Chi-Square Test problem 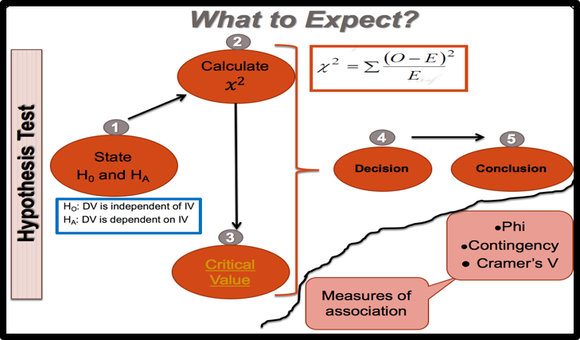 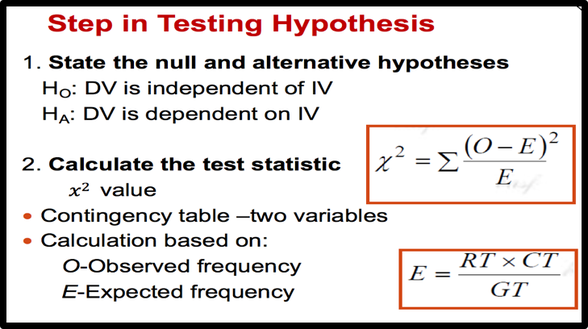 We should generate the Contingency table to calculate the Chi-Square statistics. We need two values, Observed frequency ( O) and Expected frequency ( E). Collected data are observed frequency and expected frequency can be calculated by the above formula.
 Effect Size By testing hypothesis, we can show that our result is statistically is significant. But if we want to show that our result is theoretically and practically significant, we should find the effect size. There are a number of effect size statistics (such as Phi coefficient, Cramer's V, and Contingency coefficient) that can be used to determine the strength and magnitude of the association between two variables. For 2 by 2 tables, the most commonly used one is the phi coefficient, which is a correlation coefficient and can range from 0-1, with higher values indicating a strong association between the two variables. For tables larger than 2 by 2, the value to report is Cramer's V or Contingency coefficient. 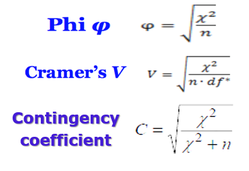 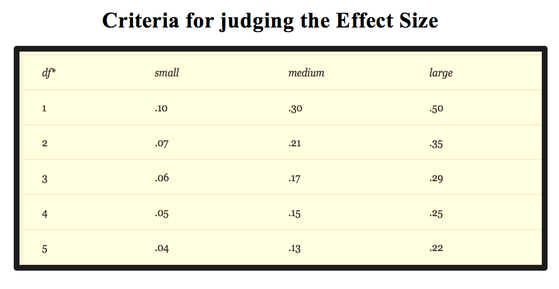 Learn how to perform the chi-square test of independence with the following examples. ( Please watch the videos) Crosstabulation with pivot table and chi-square test using Excel
1 Comment
|
Categories
All
|
||||
 RSS Feed
