 Organize data using a frequency distributionThe basic function of statistics is to organize and summarize data. Data collected in any research project are in raw and unorganized form. Not much meaning can be conveyed by raw data, unless the data are arranged or grouped in a certain manner to give more insight into the data. For example, I want to conduct a study to identify the level of customer loyalty in my company. In other words, I want to find out how many customers love my company and they will never choose another company. In this way, I can learn more about my customers. For collecting data, I can create an online questionnaire and distrubute randomly among my customers. After collecting data, I will have a big mass of data that is meaningless. To describe customer loyalty , draw conclusions, or make inferences about customer loyalty, I must organize the data in some meaningful way. The most convenient method of organizing data is to construct a frequency distribution. According to Bluman ( 2013), a frequency distribution is the organization of raw data in table form, using classes and frequencies. The reasons for constructing a frequency distribution are as follows:
Two types of frequency distributions that are most often used are the categorical frequency distribution and the grouped frequency distribution.
Grouped frequency distribution Suppose we want to identify the age of 50 students in the Statistics class. We first would have to get the data on the ages of the students. When the data are in original form, they are called raw data and are listed next. 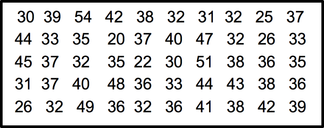 After collecting data, we will have a big mass of data that are raw and unorganized form. For organizing data, we should follow the following steps Steps in Organizing Data
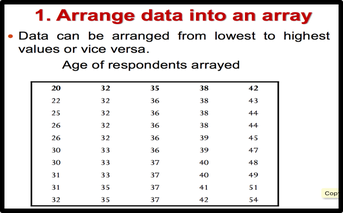
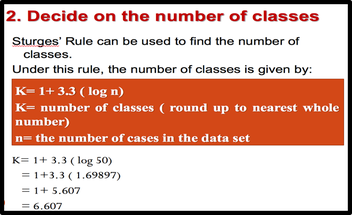
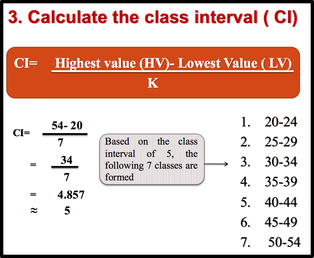
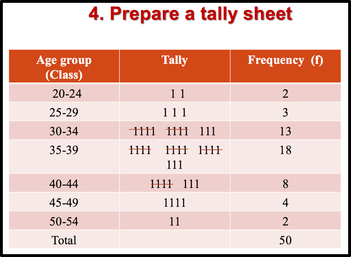
1: Arrange data into an array. The first step in organizing the data is to arrange them in an array so that we can observe the data in a more meaningful and systematic manner. Notice that data can be arranged from lowest to highest values (ascending order) or from highest to lowest values (descending order). 2: Decide on the number of classes (k) Before constructing the classes, we need to decide on the number of classes. As a general guide the recommended class number should be between 5 and 20. However, it’s just a guide. The class number can be less than 5 or more than 20. Another guideline that can be used in deciding the number of classes is to use the Sturges’ Rule. 3: Calculate the class interval (CI) 4. Prepare a tally sheet A tally sheet is important to calculate the frequency of cases in each of the seven classes.
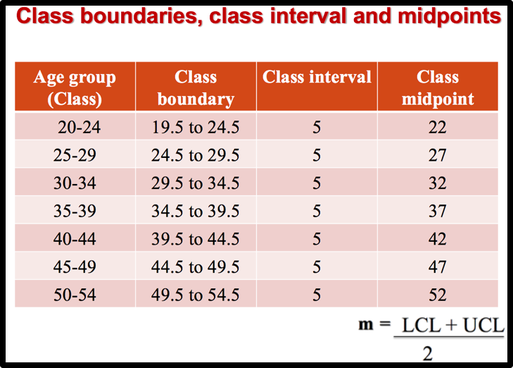 In the above distribution, the values 20 and 24 of the first class are called class limits. The lower class limit is 20; it represents the smallest data value that can be included in the class. The upper class limit is 24; it represents the largest data value that can be included in the first class. Class boundaries: These numbers are used to separate the classes so that there are no gaps in the frequency distribution. The gaps are due to the limits; for example, there is a gap between 24 and 25. we can find the boundaries by subtracting 0.5 from 20 (the lower class limit) and adding 0.5 to 24 (the upper class limit). Keep in mind that classes must be mutually exclusive. Mutually exclusive classes have nonoverlapping class limits so that data cannot be placed into two classes. To find class boundaries:
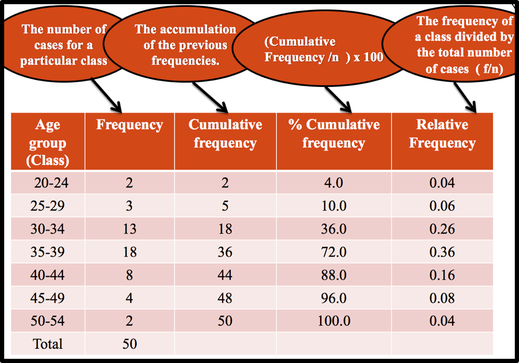 A cumulative frequency distribution ( CF) is a distribution that shows the number of data values less than or equal to a specific value (usually an upper boundary). It is obtained by adding the frequency for that class and all previous classes. Naturally, a shorter way to do this would be to just add the cumulative frequency of the class below to the frequency of the given class. For example, we can say that 18 ( 36%) students are less than or equal to 34.5 years in the third class. Alternatively, 32 (64%) of students are 34.5 years or more. Relative Frequency shows the proportion of data values that fall into a given class. In some situation, Relative frequency is more important than the actual number of data values that fall into that class. For example, if we want to compare the age distribution of students in statistics class with the age distribution of students in accounting class, you would use relative frequency distributions. The reason is that since the population of these two classes are different. To convert a frequency into a proportion or relative frequency, we should divide the frequency for each class by the total of the frequencies. The sum of the relative frequencies will always be 1. Frequency Distribution Table in Excel Elementary Statistics Lab Using Excel: Find Midpoints, Frequency, Rel Frequency, Cumulative Frequency, Cumulative Relative Frequency 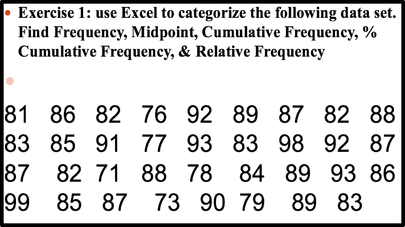 Use an Excel Pivot Table to Group Data by Age Bracket Categorical Frequency Distributions --The categorical frequency distribution is used for data that can be placed in specific categories, such as nominal- or ordinal-level data. For example, data such as political affiliation, religious affiliation, or major field of study would use categorical frequency distributions.
2 Comments
|
 RSS Feed
