Statistical GraphsAfter you have organized the data into a frequency distribution, you can present them in graphical form. The purpose of graphs in statistics is to convey the data to the viewers in pictorial form. It is easier for most people to comprehend the meaning of data presented graphically than data presented numerically in tables or frequency distributions. This is especially true if the users have little or no statistical knowledge. Statistical graphs can be used to describe the data set or to analyze it. Graphs are also useful in getting the audience’s attention in a publication or a speaking presentation. They can be used to discuss an issue, reinforce a critical point, or summarize a data set. They can also be used to discover a trend or pattern in a situation over a period of time. There are many different types of graphs but each one has a specific purpose. I divided statistical graphs into two categories . 1. Statistical graphs that can be used for quantitative data :
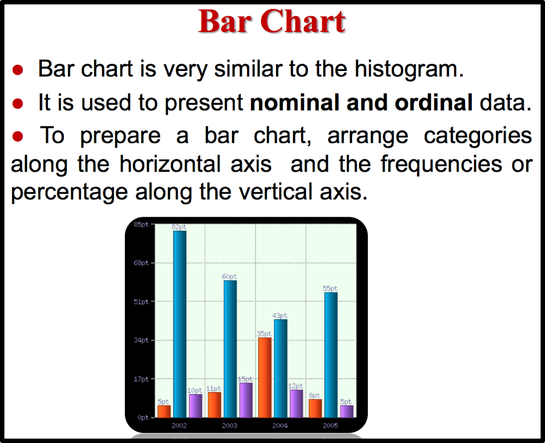
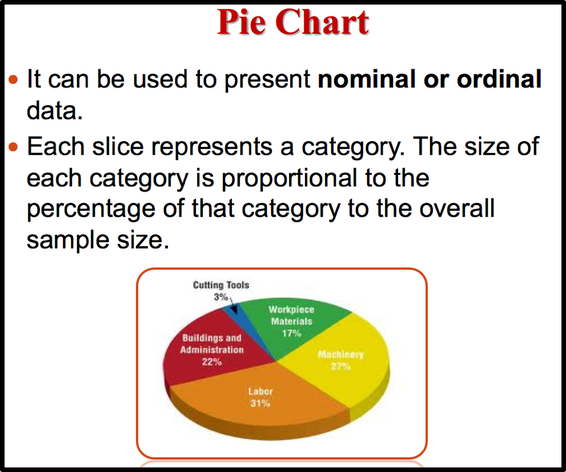
2. Statistical graphs that can be used for qualitative data :
|
| |
***Statistical graphs that can be used for qualitative data***
 |
Summary
- When data are collected, the values are called raw data. Since very little knowledge can be obtained from raw data, they must be organized in some meaningful way. A frequency distribution using classes is the common method that is used.
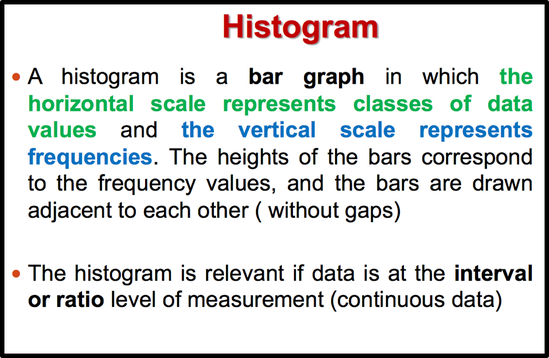
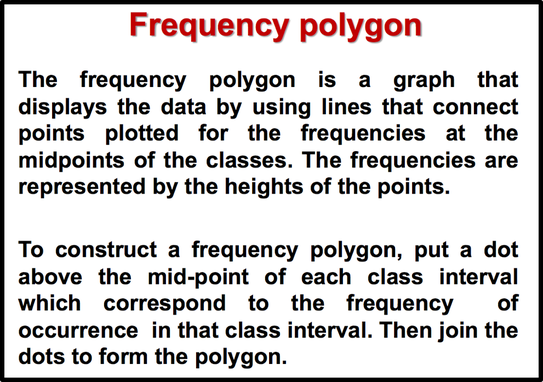
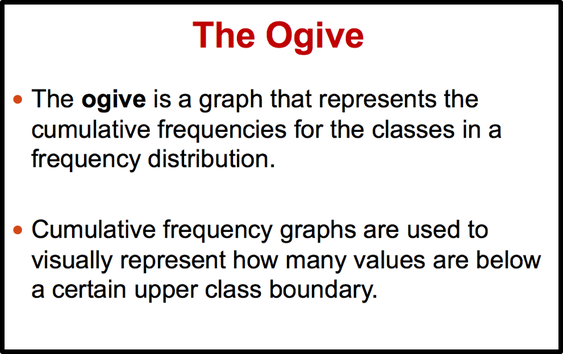
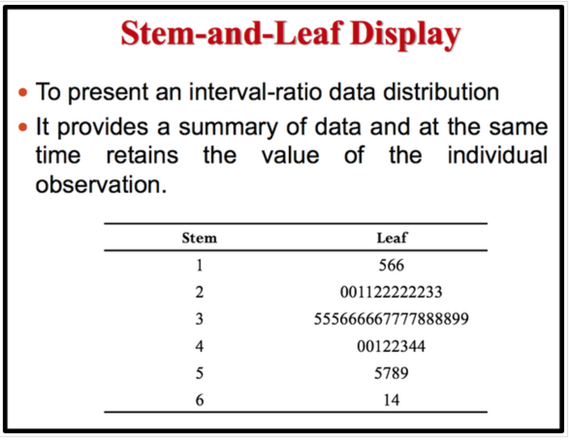
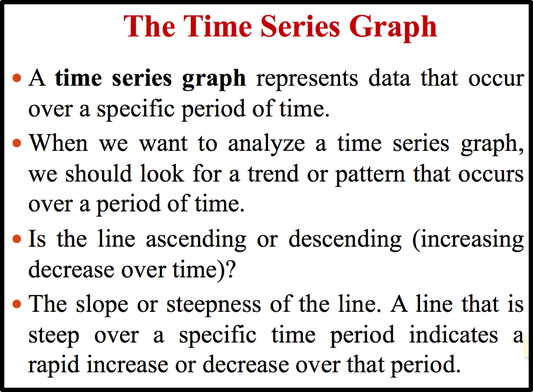
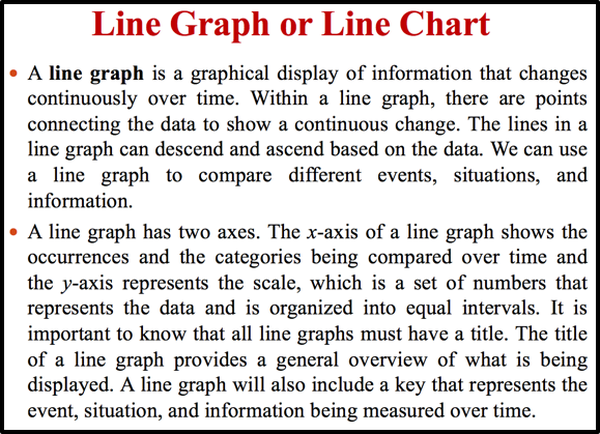
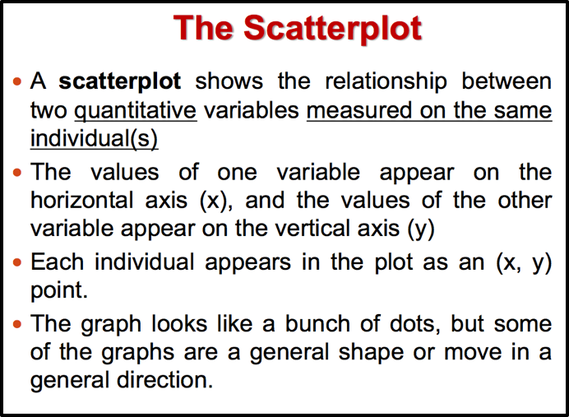
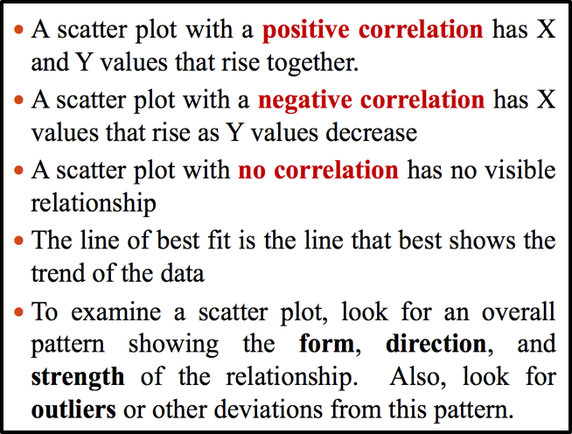
- Once a frequency distribution is constructed, graphs can be drawn to give a visual representation of the data. The most commonly used graphs in statistics are the histogram, frequency polygon, ogive, stem and leaf plot, bar graph, Pareto chart, time series graph, and pie graph .
0 Comments
 RSS Feed
