 The difference between qualitative & quantitative Research MethodTwo main types of research method are Qualitative and Quantitative research method. These two types of research method are different fundamentally. Qualitative Research is primarily exploratory research. It is used to gain an in-depth understanding of underlying reasons, opinions, and motivations. It provides insights into the problem or helps to develop ideas or hypotheses for potential quantitative research. Qualitative Research is also used to uncover trends in thought and opinions, and dive deeper into the problem. Qualitative data collection methods vary using unstructured or semi-structured techniques. Some common methods include focus groups (group discussions), individual interviews, and participation/observations. The sample size is typically small, and respondents are selected to fulfill a given quota. Quantitative Research is used to quantify the problem by way of generating numerical data or data that can be transformed into useable statistics. It is used to quantify attitudes, opinions, behaviors, and other defined variables – and generalize results from a larger sample population. Quantitative Research uses measurable data to formulate facts and uncover patterns in research. Quantitative data collection methods are much more structured than Qualitative data collection methods. Quantitative data collection methods include various forms of surveys – online surveys, paper surveys, mobile surveys and kiosk surveys, face-to-face interviews, telephone interviews, longitudinal studies, website interceptors, online polls, and systematic observations. The difference between descriptive and inferential statistics Descriptive statistics can be used to describe and summarize the characteristics of a data set. On the other hand, Inferential statistics can be used to test a hypothesis or assess whether our data is generalizable to the broader population. In the case that the population size of our study is large, we should select the sample and data will be collected from the sample. Results obtained from the sample can be generalized to an entire population of interest through the testing of hypothesis which is a decision-making process for evaluating claims about a population. In fact, setting up and testing hypotheses is an essential part of statistical inference.
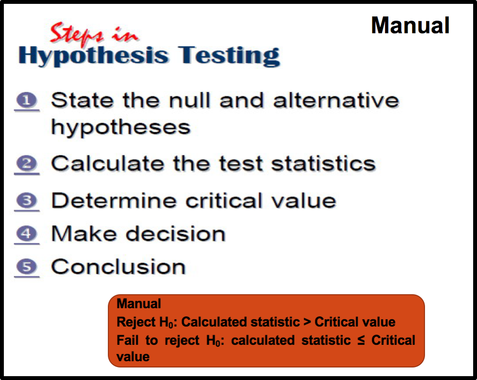
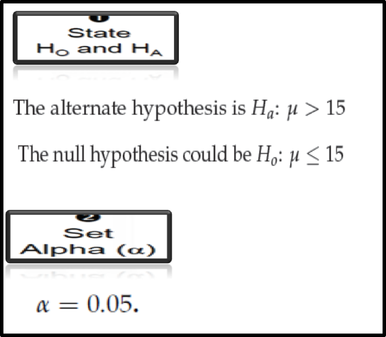
There are two types of statistical hypotheses for each situation: 1. The null hypothesis 2. The alternative hypothesis. 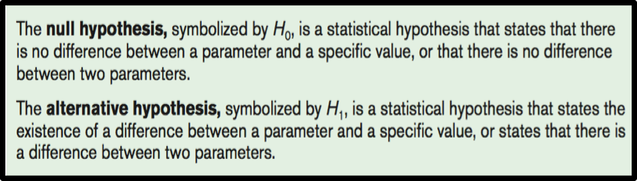 The null hypothesis is opposite of alternative hypothesis. If we can prove that the null hypothesis is false , then we can conclude that the research or alternative hypothesis is true. Example:  One-Tailed Test & Two-Tailed Test There are two forms of research hypothesis. The critical or rejection region can be one side of the distribution or both sides of the distribution depending on the nature of the research hypothesis. Directional research hypothesis or one tail test has one critical region. On the contrary, the Non-directional research hypothesis or two tail test has two rejection regions on both sides of the distribution. How to determine if it is a one tailed or two tailed test? 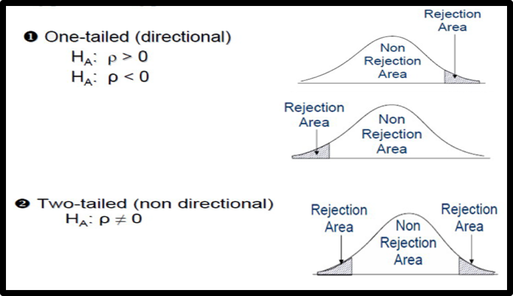 Write the null and alternative hypothesis for the following situations. Situation A A medical researcher is interested in finding out whether a new medication will have any undesirable side effects. He knows that the mean pulse rate for the population under study is 82 beats per minute. Hence, he tries to find whether the pulse rate will increase, decrease, or remain unchanged after a patient takes the medication? The hypotheses for this situation are 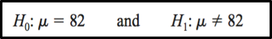 The null hypothesis specifies that the mean will remain unchanged, and the alternative hypothesis states that it will be different. This test is called a two-tailed test , since the possible side effects of the medicine could be to raise or lower the pulse rate. Situation B A chemist invents an additive to increase the life of an automobile battery. If the mean lifetime of the automobile battery without the additive is 36 months, then her hypotheses are : 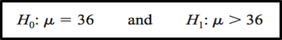 In this situation, the chemist is interested only in increasing the lifetime of the batteries, so her alternative hypothesis is that the mean is greater than 36 months. The null hypothesis is that the mean is equal to 36 months. This test is called right-tailed, since the interest is in an increase only. Situation C A contractor wishes to lower heating bills by using a special type of insulation in houses. If the average of the monthly heating bills is $78, her hypotheses about heating costs with the use of insulation are 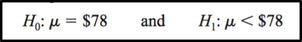 To state hypotheses correctly, researchers must translate the conjecture or claim from words into mathematical symbols. The basic symbols used are as follows: 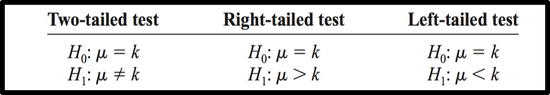 Level of Significance ( alpha value) The conclusion of the hypothesis testing must be attached to the level of confidence at which we reject the null hypothesis. Level of confidence is expressed as 90%, 95%, 99% and so on. By convention, the .05 level of significance has been considered an acceptable significant level in social science studies. 0.05 level of significance means that we are 95% confident that we have made the right decision and only 5% of incurring error. The smaller the significance level indicates, the more stringent the hypothesis testing. Critical Region Knowledge of sampling distribution enables us to decide whether to reject or fail to reject the null hypothesis. The decision is based on two criteria: the critical value of the test statistics and the significance level. The critical value is obtained from the test statistic table (e.g., Z, t, f table) corresponding to the level of significance and degrees of freedom. If the value of the test statistics is greater than the critical value, we reject the null hypothesis. In other words, we reject the null hypothesis if the value of the test statistic falls beyond the critical value and within the critical region. On the other hand, if the value of the test statistics is smaller than the critical value, we fail to reject the null hypothesis.
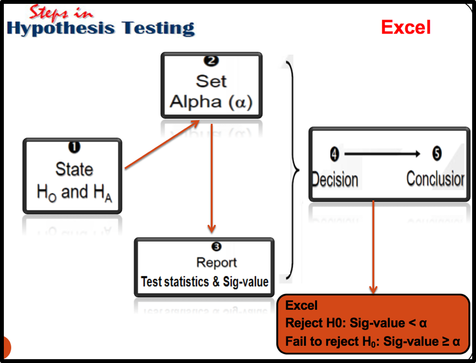
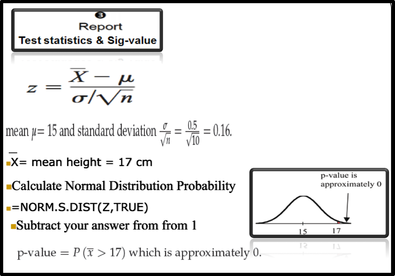
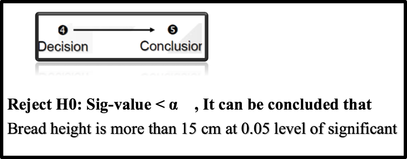
Also, if the P value (Sig-value) is smaller than the level of significance, we reject the null hypothesis. On the contrary, if the P value (Sig-value) is greater than the level of significance, we fail to reject the null hypothesis.
|
Categories
All
|
 RSS Feed
