 The purpose of using one-way analysis of variance is similar to a t-test. Both analysis can be used for comparison. Independent sample t-test is used to compare the men scores of two different groups or conditions ( K=2) while One way analysis of variance (ANOVA) is used when we want to compare the mean scores of more than two groups of people or conditions ( K>2). It is called one-way because we are looking at the impact of only one independent variable on our dependent variable. Before conducting this analysis several assumptions should be checked such as normality of our data, homogeneity of variance, independence of observations, level of measurement,and random sampling. Our independent variable should be categorical (Nominal or Ordinal) with more than two levels and our dependent variable should be continues ( Interval or Ratio). For example, we are interested in comparing the effectiveness of three different teaching styles on students’ statistics scores. Teaching style is our independent variable with three levels (e.g. whole class, small group activities, self-paced computer activities) and statistics’ score is dependent variable. The Null and Research hypothesis are: 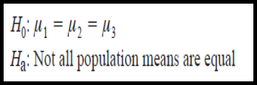 To identify whether there are significant differences in the mean scores on the dependent variable across the three groups, we should run the F-test. In fact, Analysis of variance compares the variance (variability in scores) between the different groups with the variability within each of the groups. An F ratio is calculated, which represents the variance between the groups, divided by the variance within the groups. A large F ratio indicates that there is more variability between the groups (caused by the independent variable) than there is within each group (referred to as the error term). A significant F test indicates that whether we can reject the null hypothesis or not. If Sig-F is less than alpha value, we reject the null hypothesis. So we can conclude that Not all population means all equal. If Sig-F is larger than alpha value, we fail to reject the null hypothesis. So we can conclude that all population means are equal. If we reject the null hypothesis, it does not, however, tell us which of the groups differ. For this we need to conduct post-hoc tests. Post-hoc comparisons tells us which groups are significantly different from One another. 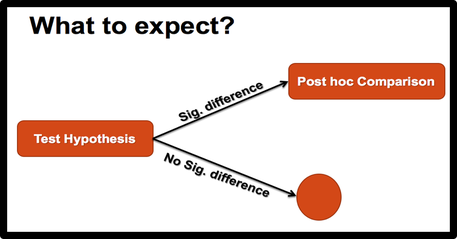 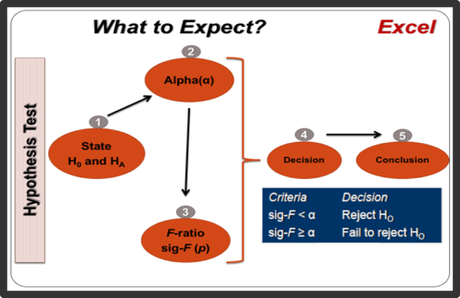 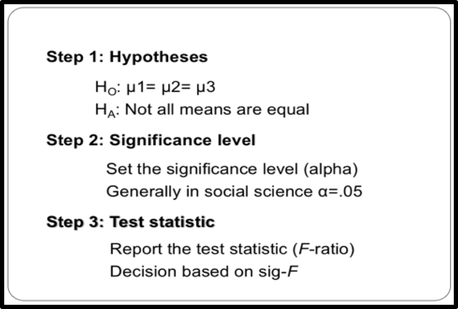 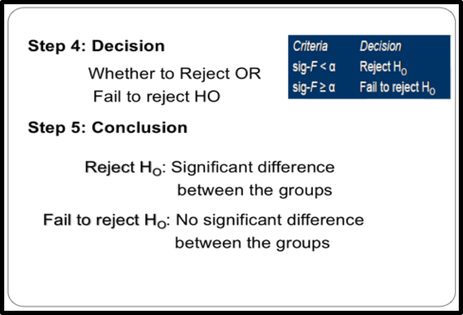 Calculating effect size Effect size can be calculated to show the importance of our findings. The following formula can be used to calculate eta squared. Cohen classifies .01 as a small effect, .06 as a medium effect and .14 as a large effect. 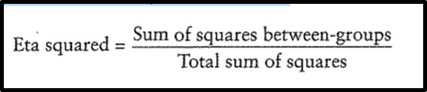 Examples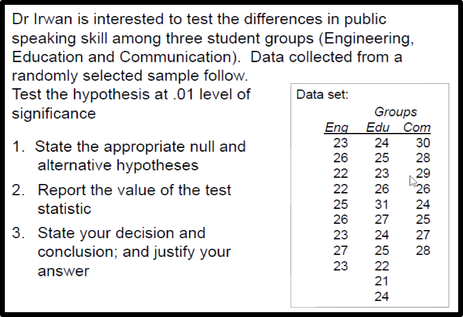 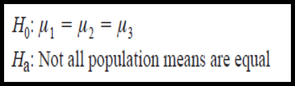 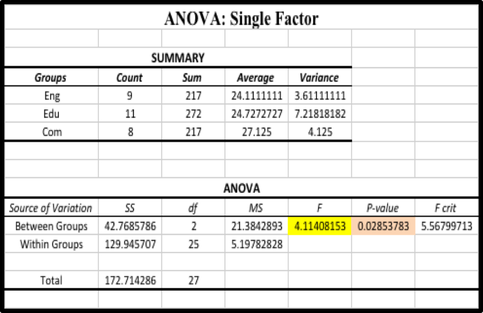 ANOVA table gives us both between-groups and within-groups sums of squares, degrees of freedom, between-groups and within-groups Mean Squared, F statistics, P-Value, and F Critical. The main thing we are interested in is the column marked P-Value. If the P-value is less than or equal to .01 or 0.0, we reject the null hypothesis. In this case, P value (0.02/2=0.014) is larger than 0.01. So, we fail to reject the null hypothesis. It can be concluded that there is not a significant difference among the mean scores on our dependent variable for the three groups. Presenting the results from one-way ANOVA A one-way analysis of variance was conducted to explore the differences in public speaking skills among three student groups. There was not a statistically significant difference at the p < .01 level in public speaking skills scores for the three student groups: F (2, 25) = 4.11, p = .01. Performing a One-way ANOVA in Excel with post-hoc t-tests
2 Comments
4/24/2023 06:29:03
Thank you for your feedback! After running One-way ANOVA in Excel, there are several post-hoc tests that can be used to determine which specific groups differ significantly from each other. Some of the commonly used post-hoc tests in Excel include Tukey's Honestly Significant Difference (HSD) test, Bonferroni correction, Scheffe's method, and Fisher's Least Significant Difference (LSD) test. Each of these tests has its own strengths and limitations and the choice of test depends on the research question and the data at hand. For example, Tukey's HSD test is a powerful test that can handle unequal sample sizes and variances across groups, while Bonferroni correction is a more conservative test that controls for the overall type I error rate. In Excel, you can perform these tests using the Data Analysis add-in and the output will provide you with the mean differences and p-values for each pair of groups. It's important to conduct post-hoc tests after ANOVA to gain a more nuanced understanding of group differences and to avoid making false conclusions about group means. Leave a Reply. |
Categories
All
|
 RSS Feed
