|
Paired –Sample T-test or Repeated Measures 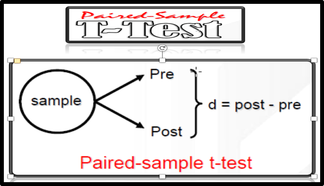 Purpose of Paired Sample T-test Compare differences between two (2) dependent mean scores A paired-samples t-test is used when you have only one group of people (or companies, Or machines etc.) and we want collect data from them on two different occasions or under two different conditions. Pre-test/post-test experimental designs are an example of the type of situation where this technique is appropriate. We should assess each person on some continuous measure at Time 1, and then again at Time 2, after exposing them to some experimental manipulation or intervention (Pre-test and Post-test scores are Interval or Ratio). This approach is used also when we have matched pairs of subjects (i.e. each person is matched with another on specific criteria, such as age, sex), One of the pair is exposed to Intervention 1 and the other is exposed to Intervention 2. Scores on a continuous measure are then compared for each pair. Paired-samples t-tests can also be used when we measure the same person in terms of his/her response to two different questions (e.g. asking him/her to rate the importance in terms of life satisfaction on two dimensions of life: health, financial security). In this case, both dimensions should be rated on the same scale (e.g. from l=not at all important to 10=very important). For example, we want to explore the impact of an intervention designed to increase students' confidence in their ability to survive a compulsory statistics course. Students were asked to complete a Fear of Statistics Test (FOST) both before (Time 1) and after the intervention (Time 2). Example of research question: Is there a significant change in participants' fear of statistics scores following participation in an intervention designed to increase students' confidence in their ability to successfully complete a statistics course? Does the intervention have an impact on participants' fear of statistics scores? What we need:
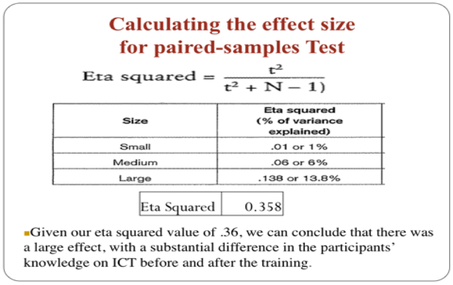
What it does: A paired-samples t-test will tell us whether there is a statistically significant difference in the mean scores for Time 1 and Time 2. Assumptions: The basic assumptions for t-tests should be checked. How to test the hypothesis for paired sample t-test 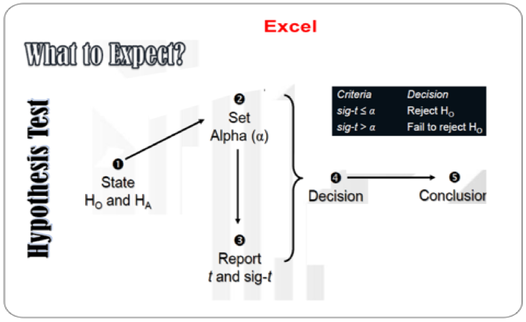  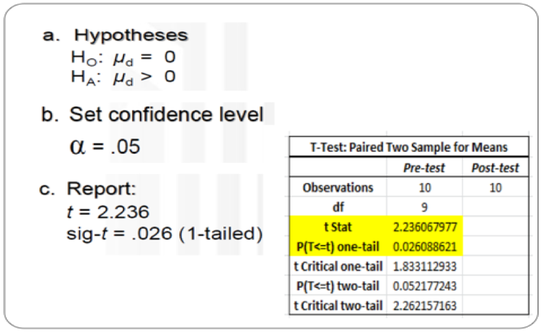 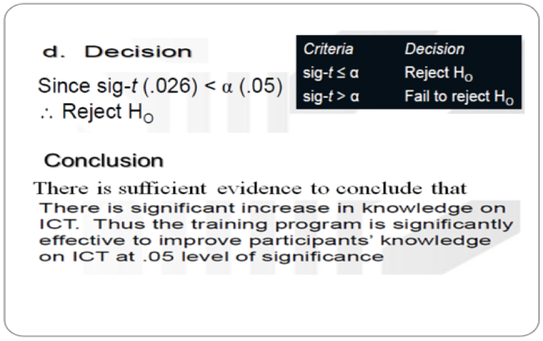 Interpretation of output from paired-samples t-test There are two steps involved in interpreting the results of this analysis. Step 1: Determining overall significance In the table labelled Paired Samples Test, we should check (p) value. If this value is less than .05 or 0.01, we can conclude that there is a significant difference between our two scores. In the example given above, the probability value is .02. This value is substantially smaller than our specified alpha value of .05. Therefore, we can conclude that there is a significant difference in participants’ knowledge of ICT scores at Time 1 and at Time 2. The t value and the degrees of freedom were 2.23 and 9 respectively. The Mean difference in the two scores was 0.5, with a 95 per cent. Step 2: Comparing mean values Having established that there is a significant difference, the next step is to find out which set of scores is higher (Time 1 or Time 2). In our case, the mean participants’ knowledge of ICT scores at Time 1 ( pre test) was 12.3 and the mean score at Time 2 ( post test) was 12.8. Therefore, we can conclude that there was a significant increase in participants’ knowledge of ICT scores from Time 1 (prior to the intervention) to Time 2 (after the intervention). Calculating the effect size for paired-samples t-test We should calculate effect size to assess the importance of our findings and identify the magnitude of the intervention’s effect. The procedure for calculating and interpreting eta squared (one of the most commonly used effect size statistics) is presented below.
The guidelines (proposed by Cohen 1988, pp. 284–7) for interpreting this value are: .01=small effect, .06=moderate effect, .14=large effect. Given our eta squared value of .35 we can conclude that there was a large effect, with a substantial difference in knowledge of ICT scores obtained before and after the intervention. Presenting the results for paired-samples t-test A paired-samples t-test was conducted to evaluate the impact of the training on participants’ knowledge of ICT scores. There was a statistically significant increase in participants’ knowledge of ICT scores from Pre test (Time 1) (M = 12.3, SD = 0.59) to post test (Time 2) (M = 12.8, SD = 0.69), t = 2.23, p <. 05 (one-tailed). The mean increase in Participants’ knowledge of ICT scores was 0.5 with a 95% confidence interval. The eta squared statistic (.35) indicated a large effect size.
1 Comment
I just read your article on Paired-Sample T-test or Repeated Measures and it was really helpful for me to understand the concept better. The way you explained the purpose, assumptions and interpretation of results in a simple and easy to understand manner is really appreciated. Your article is a great resource for anyone trying to learn about this statistical technique. Keep up the great work! Leave a Reply. |
Categories
All
|
 RSS Feed
